Tools




Project showcase
Explore some of our projects in detail. Get insight into the latest research publications and explore additional data. Go step by step through the data analysis and learn about the methods and statistics involved.
Polivax
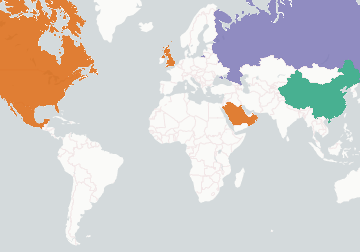
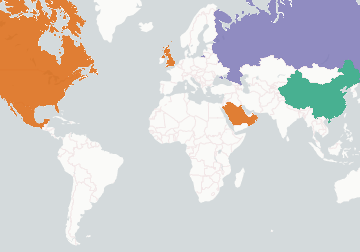
A map visualization for vaccine availability and distribution around the world. Bonus graphs in the live version.
Kvis
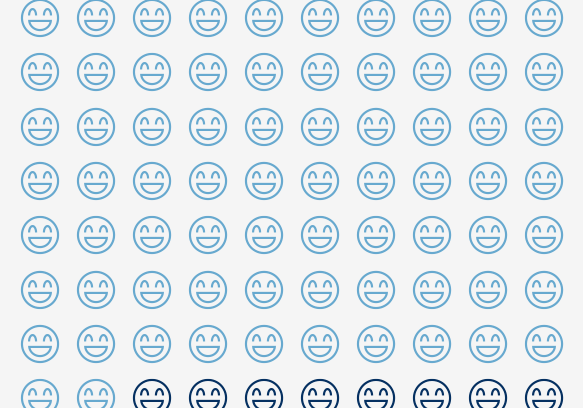
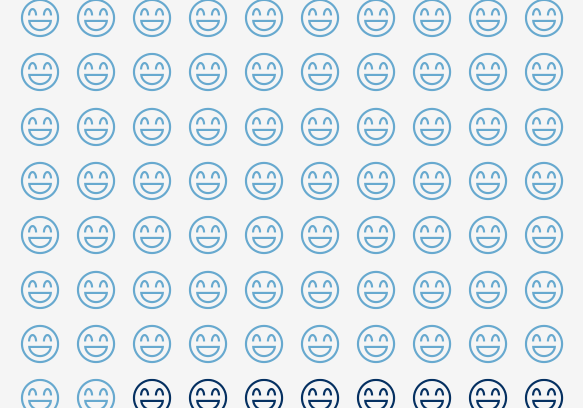
Transparent risk visualization. This tool gives detailed cardiovascular risk estimates for German citizens.
"Developing a vaccine against COVID-19 is the most pressing challenge of our time - and nobody wins the race until everyone wins" - COVAX WHO
Access to vaccines against COVID-19 is very different throughout the world. As the first doses from different manufacturers become available, on a global scale the first to be vaccinated are not the most vulnerable but the most economically rich. With Polivax we are taking a closer look where vaccines are available and how many people are getting inoculated.
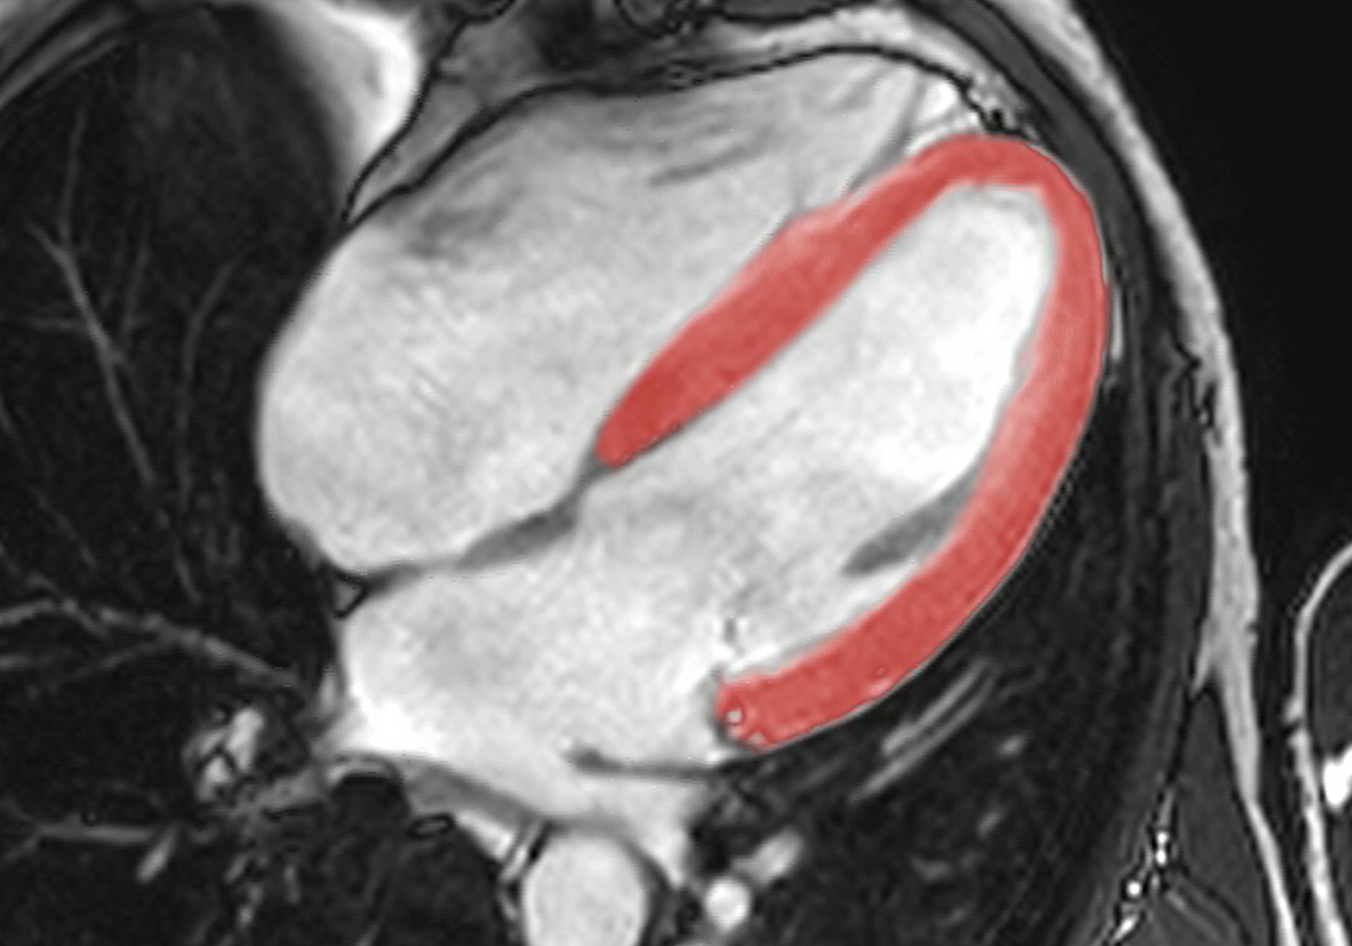
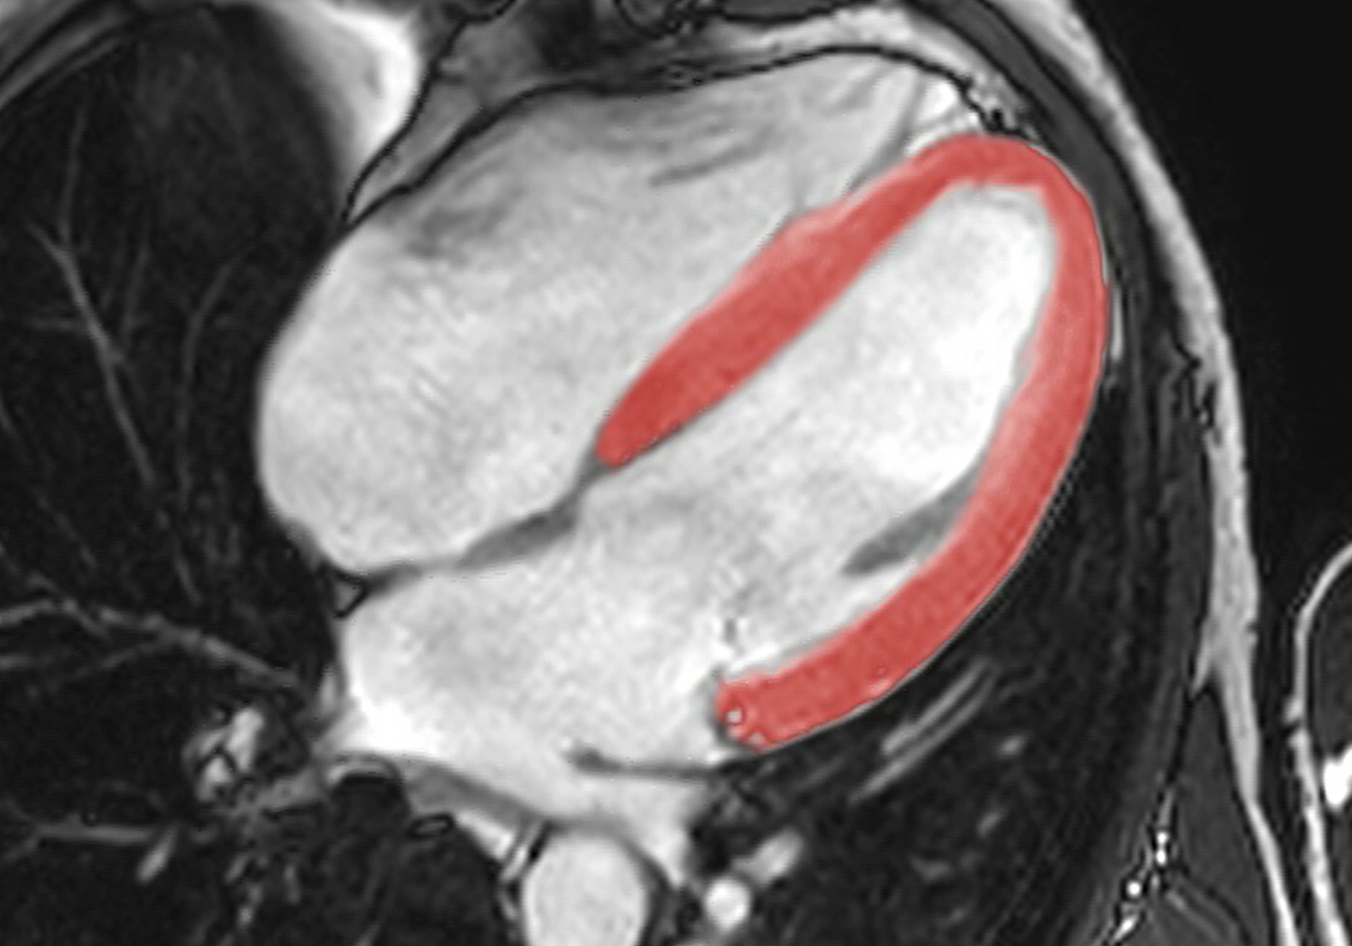
Cardiac MRI studies transformed to anatomy education tools. Given the improved resolution and methodology of cardiac MRI, never before seen details of the living heart in humans can be observed non-invasively.
Risk estimation can be extremely challenging at the level of the individuum. There a numerous risk scores available for the risk cardiovascular diseases and/or death. This tool brings the available scores relevant for German citizens together in one plays. It outlines the scientific evidence regarding each score and the methodology employed in its calculation. Furthermore it gives a visual risk estimate for each risk calculation algorithm useful for clinicians as well as patients.

